Real estate market cycles: What to know about each phase
This article is general education, not investment, financial, tax or legal advice, and nothing here is a forecast or a recommendation to buy or sell. Align Lending is a Michigan mortgage broker, not a registered investment adviser. Talk with a licensed financial advisor and a CPA before making an investment decision.
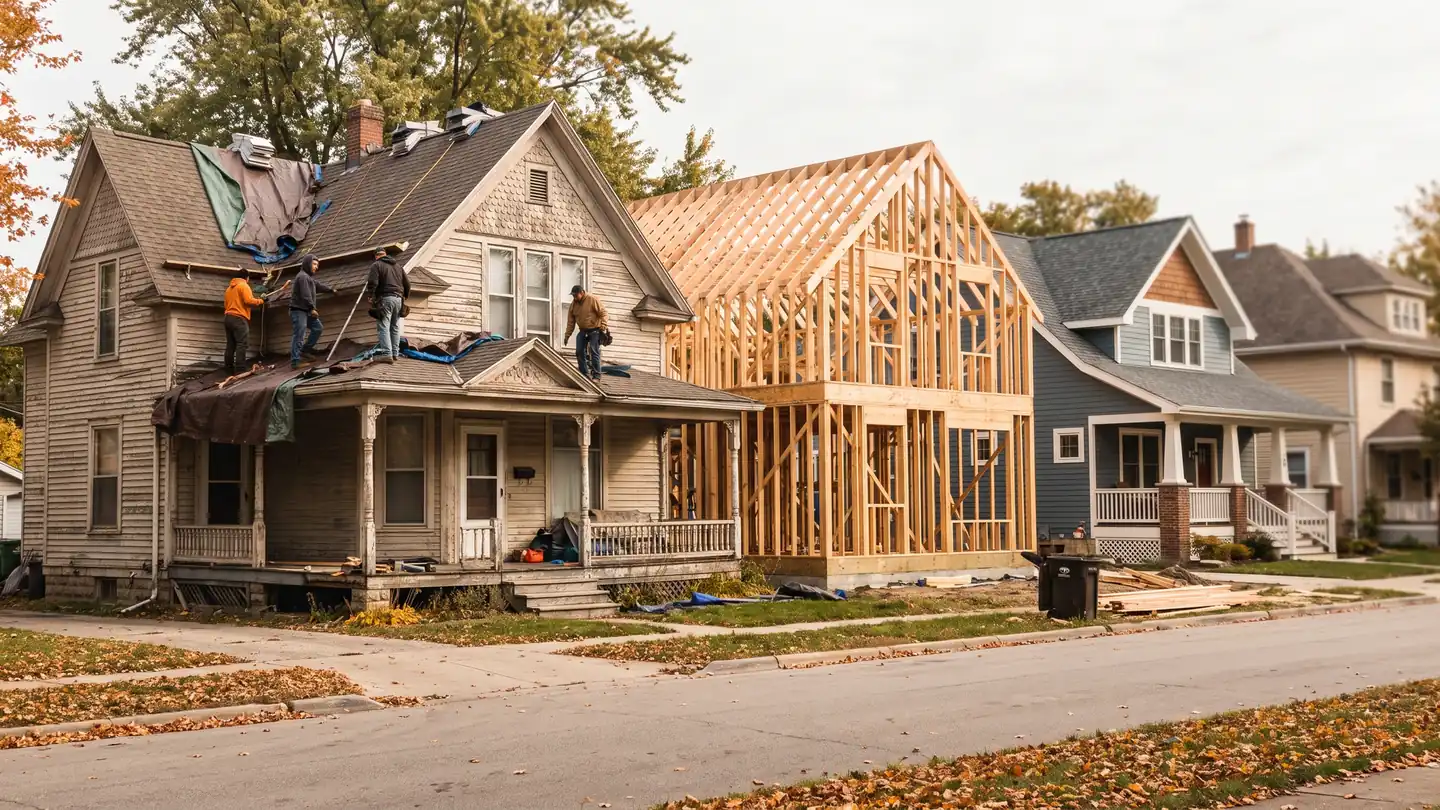
A real estate market cycle is the repeating movement of a property market through four phases (recovery, expansion, hyper supply and recession) driven by the lag between the moment demand appears and the moment new supply can actually be delivered. The last completed national turn is measurable rather than theoretical: the Federal Housing Finance Agency’s purchase-only House Price Index for the United States peaked in the first quarter of 2007, bottomed 21.2% lower in the second quarter of 2011, and did not climb back to that 2007 level until the second quarter of 2016.
One thing has to be said up front: phases are named in hindsight. No indicator, dashboard or economist can tell you with confidence which phase your market is in today.
Learn how real estate market cycles work, what each of the four phases looks like in occupancy, rent, construction and price, which indicators move first, and how financing differs from one phase to the next.
Key takeaways:
- Construction turns before price does: Census counted a peak of 2,068,300 privately owned housing starts in 2005 and 1,979,400 completions in 2006, but the FHFA national purchase-only index did not peak until the first quarter of 2007, supply rolled over 1 to 2 years ahead of price.
- The same downturn ran on very different clocks: The national purchase-only index regained its prior peak in the second quarter of 2016, roughly 9 years after peaking; the FHFA all-transactions index for the Detroit-Dearborn-Livonia division did not regain its 2005 peak until the second quarter of 2020, nearly 15 years later.
- Phases are dated backward, not forward: The National Bureau of Economic Research dated the December 2007 business-cycle peak 12 months after the fact and the June 2009 trough 15 months after the fact. Real estate phases carry the same kind of lag, which is why strategy should be built to survive being wrong about the phase.
What is a real estate market cycle, and what are the four phases?
A real estate market cycle is the recurring sequence a market moves through as supply chases demand and overshoots it. The four-phase framework in common use (recovery, expansion, hyper supply, recession) is associated with Dr. Glenn Mueller, a real estate professor at the University of Denver. Its engine is a construction lag: entitling, financing and building take years, so the supply that answers today’s demand arrives long after the demand that justified it.1 The phases repeat in order, but never on a schedule.
| Phase | Vacancy | Rent and price | Construction | Typical investor posture |
|---|---|---|---|---|
| Recovery | High, but falling | Flat to slightly rising off a low base | Minimal, almost nothing new breaking ground | Acquire and stabilize existing assets |
| Expansion | Falling through long-run average | Rising, sometimes sharply | Accelerating; permits and starts climb | Develop, reposition, or sell into strength |
| Hyper supply | Rising again, from a low base | Still rising, then decelerating, the lagging signal | Peaking, with a heavy delivery pipeline still landing | Tighten underwriting; stress-test rent and vacancy |
| Recession | High and still rising | Falling; distressed sales appear | Collapsing toward zero | Protect liquidity; buy only what you can hold |
The trap sits in row three. In hyper supply, vacancy has already turned but price has not, so the market feels like expansion right up until it does not. That gap is where most cycle mistakes get made.
What happens during the recovery phase?
Recovery is the phase where vacancy is still high but has stopped getting worse. Occupancy grinds upward off a bad base, rents stop falling, and almost nothing new breaks ground because the last cycle’s losses are fresh.
- What it looks like: Elevated vacancy declining quarter over quarter, flat to marginally positive rent growth, and starts near multi-year lows. National housing starts bottomed at 554,000 units in 2009 and were still only 608,800 in 2011.
- What confirms it: Absorption exceeding new deliveries, employment stabilizing, days on market shortening. Price moves last, and often barely moves at all early in recovery.
- How posture changes: Acquisition and stabilization rather than development, because construction costs rarely pencil against depressed rents. Investors buying here underwrite to today’s rents, not to a recovery they are counting on.2
Recovery only looks obvious on a chart drawn afterward, in real time, a recovery and a false start look identical. That is why our investor market analysis hub asks for confirmation across several series.
What happens during the expansion phase?
Expansion is the phase where vacancy drops through its long-run average and rent growth turns positive. Demand outruns available space and construction financing reopens.
- What it looks like: Falling vacancy, accelerating rent growth, rising permits and starts, shrinking days on market. In NAR’s July 2026 existing-home sales report, total housing inventory was 1.54 million units, a 4.6-month supply, with a median 29 days on market.
- What confirms it: Metro employment growth, in-migration, and new construction still being absorbed rather than sitting. Employment trends lead housing demand rather than follow it.
- How posture changes: Development and value-add work start to pencil because projected rents cover construction costs, and owners who bought in recovery often sell into it. Both moves rest on assumptions that can be wrong.
Expansion is also where discipline erodes, because rising prices make weak underwriting look smart. Where that leads is covered in housing market bubbles.
What happens during the hyper supply phase?
Hyper supply is the phase where completions begin to exceed absorption and vacancy starts climbing again. While prices and rents may still be rising. It is the phase investors most often misread as continued expansion.
- What it looks like: Vacancy rising from a low base, a heavy pipeline already committed and under construction, decelerating rent growth and lengthening days on market, with price still positive year over year.
- What confirms it: The gap between starts and completions. In Census annual data, starts in buildings of 5 or more units peaked at 531,000 in 2022, but completions of those units did not peak until 2024, at 591,700, the most in any year since 1974. Over that window the Census rental vacancy rate moved from 5.6% in the fourth quarter of 2021 to 7.3% in the second quarter of 2026.
- How posture changes: Underwriting tightens. Stress-testing rent growth at zero, vacancy above your pro forma and a longer lease-up is the whole job here.
That pattern does not establish that the national market is in hyper supply now, the label gets applied by later data, metros and property types run separately, and none of it says what comes next. It illustrates the mechanism: units committed in one phase land in the next, whether or not demand is still there.
What happens during the recession phase?
Recession is the phase where demand falls, vacancy climbs, rents and prices decline and construction shuts down. It is also where the next recovery is built, as the supply pipeline empties.
- What it looks like: Falling prices, rising vacancy, negative rent growth, weakening employment and more distressed sales. Census counted housing starts falling from 2,068,300 units in 2005 to 554,000 in 2009, roughly 73% in 4 years.
- What confirms it: Sustained price declines across several quarters plus a pipeline near replacement lows. Liquidity dries up first.
- How posture changes: Capital preservation. Owners with reserves and long-dated fixed financing have options; owners with short maturities and thin coverage often do not. The mechanics of the decline itself are covered in real estate market corrections.
Construction stops, population does not, and the shortfall built during the shutdown becomes the demand behind the following recovery. That is why the phases repeat instead of ending.
Which indicators turn first, and why does price confirm last?
Vacancy and construction lead; price lags. The 2005 to 2007 sequence is the cleanest demonstration, and every number in it comes from a primary federal release.
- Starts turned first, 2005: Total privately owned housing starts peaked at 2,068,300 units and fell every year through 2009. Census new residential construction data publishes permits, starts and completions monthly.
- Completions turned second, 2006: Completions peaked at 1,979,400 units, a year after starts, because units already under construction have to finish.
- Price turned last, 2007: The FHFA purchase-only index peaked in the first quarter of 2007, one to two years after the construction data had rolled over. The FHFA House Price Index publishes national, state and metro series.
- Vacancy tracked the damage, 2009: The Census rental vacancy rate reached 11.1% in the third quarter of 2009, its high for that cycle.
The rule falls out of that ordering: watch supply and occupancy, treat price as confirmation rather than signal, and never let a rising price override what vacancy is saying. Running this same supply-versus-absorption test at the submarket and product level, rather than nationally, is real estate market saturation; the full taxonomy of what an owner is exposed to across every phase is real estate market risk. These series describe conditions; they do not forecast them. Housing market forecasting carries an honest error bar, and real estate market volatility is why it is wide.
How does financing change across the phases?
Financing structure is the part of cycle strategy an investor actually controls. Align Lending does not select markets, manage property or give investment advice, we shop the loan. Four structural questions matter more than the phase label.
- The maturity date: Short-term or balloon financing forces a refinance on a date you do not choose. Long, fixed, fully amortizing debt is what lets an owner sit through a recession phase instead of selling into it.
- Rental income in qualifying: Agency rules govern how much documented rental income counts toward your ratios, and the answer differs between a property you already own and one you are buying.
- The financed-property limit: Under Fannie Mae Selling Guide B2-2-03, updated November 5, 2025, a borrower may have a maximum of 10 financed properties when the subject transaction is a second home or investment property. Investors at that ceiling move to DSCR, non-QM or portfolio products through lenders in our network.
- Reserves, not just rate: Agency reserve requirements scale with the number of financed properties, and reserves are what turn a bad phase into an inconvenience instead of a forced sale.
For current market rates, use Freddie Mac’s Primary Mortgage Market Survey rather than any single lender’s advertised number. On the loan side, see buying a home as an investment property, how to refinance an investment property and the benefits of working with a mortgage broker.
What Michigan investors should know
Michigan is a case study in how far one state can diverge from the national cycle, and how far its own metros diverge from each other.
- Michigan peaked before the country did: The FHFA purchase-only index for Michigan peaked in the third quarter of 2005, six quarters ahead of the national peak, and fell 31.8% to its second-quarter 2011 trough, against 21.2% nationally. It did not regain that 2005 level until the second quarter of 2017.
- Metro Detroit’s cycle was deeper and far longer: On the FHFA all-transactions index, Detroit-Dearborn-Livonia fell 41.2% from its 2005 peak to its 2011 trough and did not regain that peak until the second quarter of 2020, roughly 15 years peak to peak, against about 9 nationally.
- Grand Rapids ran a much shallower cycle: Grand Rapids-Wyoming-Kentwood fell 20.9% over the same window and was back to its prior peak by the first quarter of 2016, over four years ahead of Detroit-Dearborn-Livonia. Ann Arbor sat between, down 27.3% and back to peak in 2017.
- The labor market explains much of the gap: Michigan’s annual average unemployment rate rose from 6.8% in 2005 to 13.5% in 2009 before falling to 4.7% in 2024, per the Bureau of Labor Statistics Local Area Unemployment Statistics series for Michigan. Concentrated employment shocks deepen a metro’s cycle.
The lesson is not that Detroit is risky and Grand Rapids is safe. That would be a market call, and past cycle depth does not predict future depth. It is that “the market” is not one thing. Analyze your property type in your metro using how to evaluate a real estate market for investment and analyzing rental market trends, and consider whether real estate market diversification belongs in your plan.
How Align supports your analysis
Your analysis tells you whether a property works. Samantha tells you what it will cost to finance, using real offers from multiple wholesale lenders rather than a rate you saw online.
She lives and works in Oakland County, so local questions, including what Michigan's tax uncapping does to a rental's tax bill after you buy, are part of the conversation.
FAQ: Real estate market cycles
Here are answers to common questions about real estate market cycles.
What are the four phases of the real estate cycle?
Recovery, expansion, hyper supply and recession. Recovery brings high but falling vacancy, flat prices and almost no new construction. Expansion brings falling vacancy, rising rents and rising development. Hyper supply arrives when completions outpace absorption and vacancy climbs while prices still look strong. Recession follows: demand falls, prices decline and distressed assets appear, setting up the next recovery. See our real estate investing guide.
How long does a real estate cycle last?
There is no fixed length. Measured peak to peak on the FHFA indexes, the national purchase-only series took about 9 years to regain its 2007 peak, while the all-transactions index for Detroit-Dearborn-Livonia took nearly 15 years to regain its 2005 peak. Treat the framework as a way to describe conditions, not as a calendar.
What indicators tell you which phase a market is in?
Vacancy direction, construction starts and completions, absorption, months of supply, days on market, rent growth and employment. Vacancy and construction lead; price confirms last. In the last national cycle, starts peaked in 2005 and completions in 2006, but the FHFA purchase-only index did not peak until the first quarter of 2007. Even so, phases are labeled reliably only afterward.
Can different property types be in different phases at once?
Yes, and they routinely are. Property types have separate construction pipelines and demand drivers, so multifamily, industrial, retail and office can move in different directions inside one metro, and two metros in one state diverge sharply: Detroit-Dearborn-Livonia fell 41.2% peak to trough on the FHFA all-transactions index while Grand Rapids-Wyoming-Kentwood fell 20.9%.
The bottom line on real estate market cycles
Real estate markets move through four phases (recovery, expansion, hyper supply and recession) and the engine is the lag between when demand appears and when supply can be delivered. Construction and vacancy turn before price: national housing starts peaked at 2,068,300 units in 2005 and completions at 1,979,400 in 2006, but the FHFA purchase-only index did not peak until the first quarter of 2007 and did not return to that level until the second quarter of 2016. Phases are identified reliably only in hindsight, nobody can tell you which phase you are in today, and the sound response is to build a position that survives being wrong rather than one that requires being right.
If you’re ready to finance an investment property in a way that gives you staying power through any phase, talk to Align Lending. We’ll shop your scenario across our lender network and show you the numbers side by side. Call 248-506-5727 or start online. Take investment decisions to a licensed financial advisor and tax questions to a CPA.
Footnotes:
1. The four-phase framework is a descriptive model, not a predictive one. Cycle phases are identified reliably only after the fact, and reasonable analysts disagree about which phase a market occupied even in retrospect. Nothing in this article characterizes the current national, state or metro market as being in any particular phase, and nothing here should be read as a projection of future prices, rents or interest rates. House price index figures cited are from the Federal Housing Finance Agency; the purchase-only index and the all-transactions index use different transaction sets and are not directly comparable to each other or to other published price measures, and FHFA revises its indexes with each release. Return to text.
2. This article is for informational purposes only and is not investment, financial, tax or legal advice. Align Lending is an independent Michigan mortgage broker, NMLS #2041154; it is not a registered investment adviser, a broker-dealer, a real estate brokerage, a property manager or a law firm, and it does not select markets, evaluate properties or recommend investment strategies. Descriptions of what investors typically do in each phase are general education, not recommendations, and no strategy protects against loss. Discuss any investment decision with a licensed financial advisor and the tax treatment of rental property with a CPA. Loan program terms, qualifying rules and reserve requirements are set by lenders and the agencies, vary by borrower and property, and change over time; confirm current terms with your loan officer. Return to text.
Sources: National purchase-only House Price Index for the United States, seasonally and not seasonally adjusted, and state and metropolitan-division all-transactions and purchase-only indexes for Michigan, Detroit-Dearborn-Livonia, Warren-Troy-Farmington Hills, Grand Rapids-Wyoming-Kentwood and Ann Arbor, quarterly through the second quarter of 2026, Federal Housing Finance Agency House Price Index datasets. U.S. purchase-only index, seasonally adjusted, values of 222.84 (2007 Q1 peak), 175.49 (2011 Q2 trough) and 223.11 (2016 Q2); Michigan purchase-only seasonally adjusted values of 199.88 (2005 Q3 peak), 136.38 (2011 Q2 trough) and 202.45 (2017 Q2); all-transactions index values for Detroit-Dearborn-Livonia of 187.48 (2005 Q3 peak), 110.16 (2011 Q2 trough) and 187.52 (2020 Q2), for Grand Rapids-Wyoming-Kentwood of 167.61 (2005 Q3 peak), 132.57 (2011 Q2 trough) and 167.78 (2016 Q1), and for Ann Arbor of 187.80 (2005 Q3 peak), 136.60 (2012 Q1 trough) and 194.17 (2017 Q2), same datasets. Total privately owned housing units started and completed, annual data by structure size, 1959 to 2025, U.S. Census Bureau and U.S. Department of Housing and Urban Development, New Residential Construction, Survey of Construction. Rental vacancy rate for the United States, quarterly through the second quarter of 2026, U.S. Census Bureau, Housing Vacancy Survey. Median existing-home price of $434,100 in July 2026, up 2.0% from $425,700 in July 2025 and the 37th consecutive month of year-over-year increases; existing-home sales at a 4.06 million seasonally adjusted annual rate, down 1.7% from June and up 0.7% year over year; total housing inventory of 1.54 million units, a 4.6-month supply; median 29 days on market; all-cash purchases 26% of transactions, National Association of REALTORS® Existing-Home Sales, July 2026, released August 11, 2026. Determination of the December 2007 business-cycle peak announced December 1, 2008, and the June 2009 trough announced September 20, 2010, National Bureau of Economic Research, Business Cycle Dating Committee announcements. Maximum of 10 financed properties for the same borrower when the subject transaction is a second home or investment property, and reserve requirements that scale with the number of financed properties, Fannie Mae Selling Guide B2-2-03, Multiple Financed Properties for the Same Borrower, updated November 5, 2025, and B3-4.1-01. Michigan annual average unemployment rates of 6.8% (2005), 13.5% (2009) and 4.7% (2024), not seasonally adjusted, series LAUST260000000000003, U.S. Bureau of Labor Statistics, Local Area Unemployment Statistics. The four-phase physical market cycle framework is associated with Dr. Glenn Mueller, University of Denver. Weekly average mortgage rates, Freddie Mac Primary Mortgage Market Survey. Further reading: the FHFA House Price Index and Census new residential construction data.
This article is for informational purposes only and is not intended to provide investment, legal, financial or tax advice, and it is not a forecast or a recommendation to buy, sell or hold any property or security. Market cycle phases are identified reliably only in hindsight; past market behavior does not predict future results. Consult a licensed financial advisor about investment decisions, a CPA about tax treatment, and a Michigan attorney about legal questions, and confirm loan terms with your loan officer. Align Lending is an independent Michigan mortgage broker, NMLS #2041154, and is not a registered investment adviser, a property manager or a law firm.
Related resources

12-minute read
How to evaluate a property’s location: A block-level checklist for investors
Discover how to evaluate a property’s location using job growth, school ratings, crime data, transit access, and zoning before you commit capital.

12-minute read
How to analyze rental market trends: A landlord’s step-by-step guide
Learn how to analyze rental market trends using vacancy rates, days on market and rent comps so you can price units competitively and cut costly vacancy.

13-minute read
Economic factors driving housing demand, and how investors should read them
Learn which economic factors drive housing demand, from 6% to 7% mortgage rates and labor market strength to migration and supply limits, so you can plan.