
The 12 safest cities in the US for buying a home
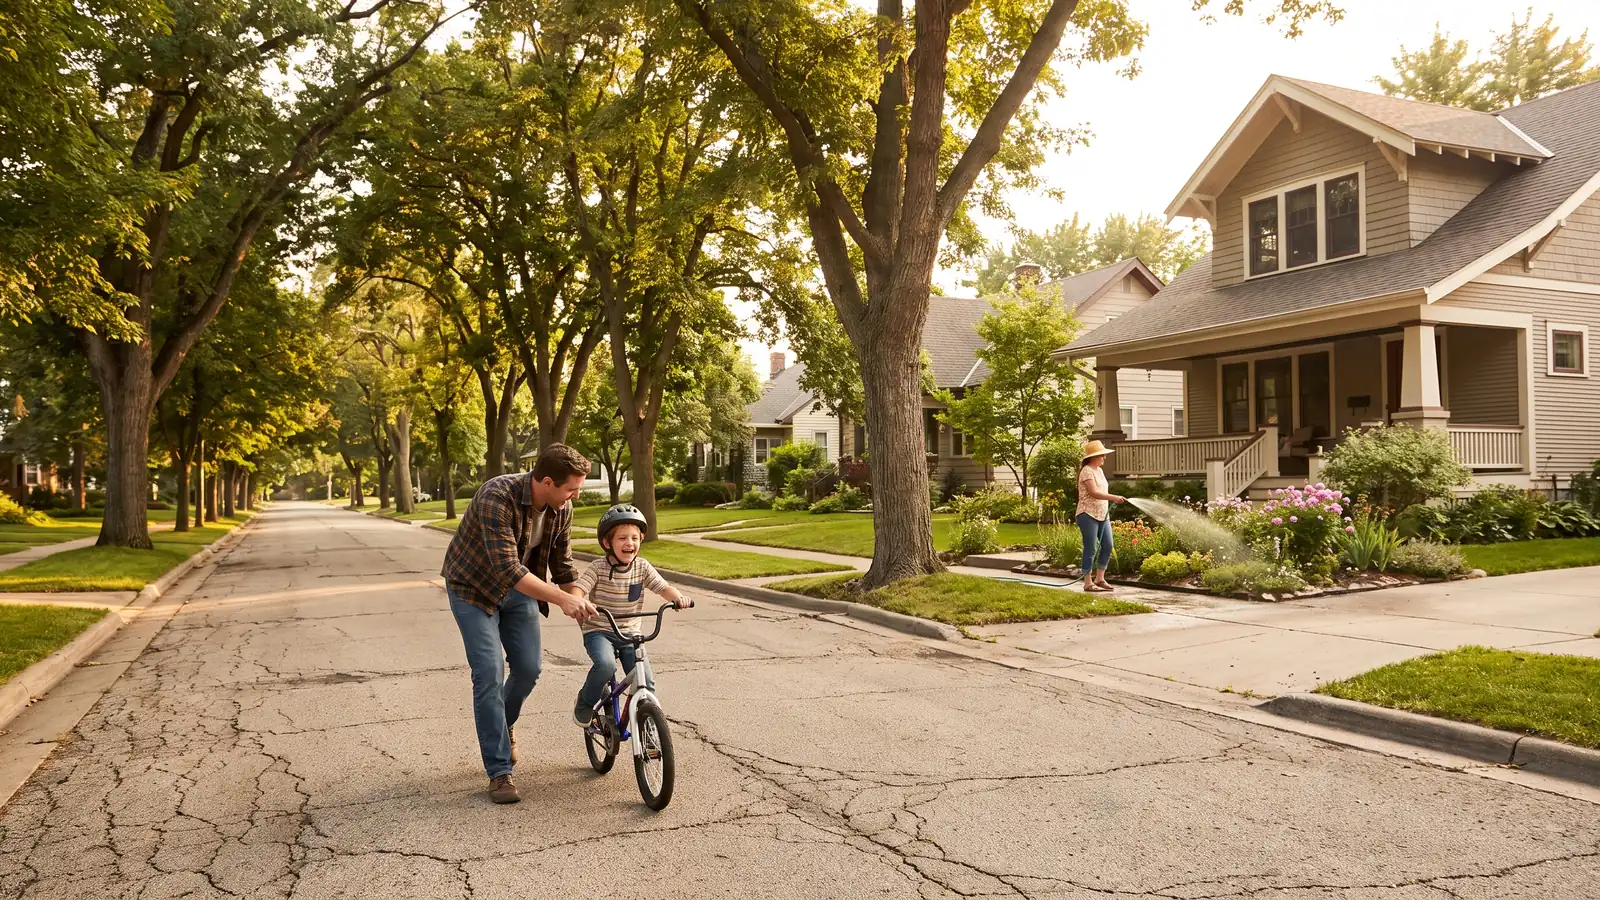
The safest U.S. cities for home buyers combine low violent and property crime with safe roads and stable neighborhoods, and several of them are surprisingly affordable. San Jose, California topped SmartAsset’s 2025 America’s Safest Cities study of the 50 largest U.S. cities, scoring in the top 10 on all five metrics the firm measured, while Plano, Texas ranked 2nd of 83 big cities in SmartAsset’s July 2026 update. Three Texas cities, Fort Worth, Arlington, and El Paso, all landed in the top 10 of the 2025 study while carrying monthly housing costs between $1,044 and $1,489 against local median household incomes of $58,734 to $76,602.
Those two SmartAsset studies used different metrics and a different pool of cities, which is exactly why one city can look like the safest place in America on one list and unremarkable on another. The 12 cities below appear across five separate rankings, and each entry names the study, the year, and what it actually measured.
Learn which cities rank as the safest in the US, including how the major rankings are built, what each city costs relative to local income, and how to check safety at the street level before you write an offer. If you’re still deciding what kind of place you want, our Homeownership guide covers the rest of the decision.
Key takeaways:
- The top of the list moves: San Jose, CA ranked 1st of 50 large cities in SmartAsset’s 2025 safety study, but the firm’s July 2026 study of 83 big cities put Virginia Beach 1st and Plano 2nd, different metrics, different winner.
- Safe does not have to mean expensive: Fort Worth (#3), Arlington (#7), and El Paso (#8) all ranked in the 2025 top 10, and El Paso’s $1,044 median monthly housing cost was the lowest of the three against a $58,734 median household income.
- Check the metric before you trust the ranking: San Francisco ranked 37th of 50 in 2025 despite low violent crime, dragged down by property crime and 63 overdose deaths per 100,000 residents, so compare the specific measure that matters to you, not the headline number.
How these cities were ranked
Every ranking on this page is built from some combination of five measures: violent crime rate, property crime rate, traffic or vehicular death rate, natural-disaster risk, and public-health indicators such as drug overdose deaths. No two publishers weight them the same way, and that single fact explains most of the disagreement between lists.1
Here are the five studies cited below, with what each one actually measures.
- SmartAsset, America’s Safest Cities (2025): Ranked the 50 largest U.S. cities on violent crime, property crime, vehicular mortality, drug poisoning mortality, and excessive drinking, using FBI Uniform Crime Reporting data for 2023, the 2025 County Health Rankings, and the Census Bureau’s 2023 five-year American Community Survey for housing and income.
- SmartAsset, America’s Safest Big Cities (July 2026): Ranked 83 cities of 250,000 or more residents on violent crime, property crime, traffic fatalities, and disaster risk, using the FBI’s 2024 Crime in the United States, CDC mortality data, and FEMA’s National Risk Index as of April 2026.
- SmartAsset, America’s Safest Midsize Cities (May 2026): Applied the same four metrics to more than 300 cities of 65,000 to 250,000 residents and published a 75-city list.
- WalletHub, Safest Cities in America (2026): Scored 182 cities out of 100 points across home and community safety (60 points), natural-disaster risk (20), and financial safety (20), drawing on Census, FBI, FEMA, NHTSA, FTC, and TransUnion data.
- Allstate, America’s Best Drivers Report (2026): Ranked the 200 most populous U.S. cities by property damage claim frequency from January 2023 through December 2024, across a book of business representing roughly 10% of U.S. auto policies. It measures driving risk only, not crime.
One caveat worth carrying through the whole list: the FBI, whose data feeds nearly all of these rankings, formally cautions against using its statistics to rank places at all, warning that such rankings “lead to simplistic and/or incomplete analyses that often create misleading perceptions.” Treat every ranking here as a screening tool, not a verdict.
1. San Jose, CA
Why it ranks: San Jose finished 1st among the 50 largest U.S. cities in SmartAsset’s 2025 study, the only city in that field to place in the top 10 on every metric measured.
Safety metrics: Third-lowest violent crime rate per capita among the large cities studied, 17 drug overdose deaths per 100,000 residents, and fewer than 7 traffic deaths per 100,000. WalletHub’s 2026 index, which adds disaster risk and financial-stability measures, placed San Jose 84th of 182. The sharpest example on this page of how much methodology matters.
Housing cost picture: The most expensive market on this list. Silicon Valley pricing means the safety premium here is real and large, and it pushes many buyers toward the peninsula’s outer edges. Our breakdown of regional housing market differences explains why West Coast metros price the way they do.
Best for: Buyers whose income is tied to the local tech economy and who can absorb coastal California pricing.
2. Naperville, IL
Why it ranks: SmartAsset’s May 2026 midsize-cities study ranked Naperville 26th on its published list of the 75 safest midsize cities, drawn from more than 300 cities in the 65,000–250,000 population band.
Safety metrics: 0.84 violent crimes and 8.84 property crimes per 1,000 residents, and 4.91 auto fatalities per 100,000. The violent crime number is among the lowest of any city on this page. Its drag is disaster risk, which FEMA rates relatively high for DuPage County.
Housing cost picture: A DuPage County suburb roughly 30 miles west of Chicago, priced well above the Illinois median. You pay for the school districts as much as the crime rate.
Best for: Families who want big-metro job access without big-metro density, the classic case laid out in our comparison of urban vs. suburban housing markets.
3. Irvine, CA
Why it ranks: The City of Irvine reported in October 2023 that Irvine had the lowest per capita violent crime rate of any U.S. city with a population of 250,000 or more for the 18th consecutive year, based on FBI data.
Safety metrics: SmartAsset’s July 2026 big-cities study ranked Irvine 12th of 83; WalletHub’s 2026 index ranked it 17th of 182. Two very different methodologies put Irvine in roughly the same place, which is a stronger signal than any single No. 1 finish.
Housing cost picture: Orange County pricing, second only to San Jose on this list. Master-planned neighborhoods and heavy HOA coverage are the norm, so budget for dues on top of principal, interest, taxes, and insurance.
Best for: Buyers who want a low-crime record with the longest track record on this list and can carry Southern California costs.
4. Plano, TX
Why it ranks: Plano finished 2nd of 83 big cities in SmartAsset’s July 2026 study, the highest current placement of any city on this page.
Safety metrics: 1.5 violent crimes per 1,000 residents, 14.7 property crimes per 1,000, and 6.9 traffic deaths per 100,000. Its weak spot is disaster risk, rated relatively high for tornado, flood, and extreme-heat exposure. WalletHub, which weights natural-disaster risk at 20% of its score, ranked Plano 109th of 182, the same city, two defensible answers.
Housing cost picture: Higher than Fort Worth or Arlington and among the priciest submarkets in North Texas, but still moderate against national averages for a city of its safety profile.
Best for: Buyers who prioritize crime and traffic data and are comfortable insuring against severe-weather risk.
5. Boise, ID
Why it ranks: Boise placed 3rd of the 200 most populous cities in Allstate’s 2026 America’s Best Drivers Report, with an average of 14.07 years between collisions.
Safety metrics: WalletHub ranked Boise 12th of 182 in 2026, and SmartAsset’s midsize study placed it 32nd on its 75-city list. Three independent methodologies, three top-quartile finishes.
Housing cost picture: The Mountain West’s pricing has climbed hard over the past decade, so Boise is no longer the bargain it was, but it remains materially cheaper than the California markets that feed much of its in-migration.
Best for: Buyers relocating from higher-cost Western metros who want outdoor access and short commutes.
6. Fort Worth, TX
Why it ranks: Fort Worth ranked 3rd of the 50 largest U.S. cities in SmartAsset’s 2025 study, the highest finish of any Texas city in that field.
Safety metrics: Moderate crime rates paired with relatively low overdose deaths. SmartAsset’s July 2026 big-cities study, which added FEMA disaster risk to the mix, released only its 10 safest and 10 least safe cities, and Fort Worth is on neither list, so the 2025 finish is the sourced number here, and North Texas weather exposure is something to price separately.
Housing cost picture: Median monthly housing costs of $1,489 against a median household income of $76,602, one of the healthier cost-to-income ratios on this list for a city of nearly a million people.
Best for: Buyers who want big-city amenities and job depth without coastal pricing.
7. Arlington, TX
Why it ranks: Arlington finished 7th of the 50 largest U.S. cities in SmartAsset’s 2025 study, the middle of the three Texas cities in that top 10.
Safety metrics: Moderate violent and property crime with low overdose mortality. SmartAsset’s July 2026 big-cities study published only its 10 safest and 10 least safe, and Arlington appears on neither list, so treat the 2025 finish as the sourced one and pull city data directly before you draw a conclusion about disaster risk.
Housing cost picture: $1,420 in median monthly housing costs against a $73,519 median household income, the second-best cost-to-income picture among the three Texas cities in the 2025 top 10.
Best for: Commuters who want Dallas and Fort Worth both within reach on a mid-market budget.
8. El Paso, TX
Why it ranks: El Paso ranked 8th of the 50 largest U.S. cities in SmartAsset’s 2025 study, and it is the affordability standout of the group.
Safety metrics: Low violent crime rates for a city of its size, with overdose mortality well below the large-city norm.
Housing cost picture: $1,044 in median monthly housing costs, the lowest figure among the cities with published cost data here, against a $58,734 median household income. The income is lower too, so run the ratio rather than the headline price.
Best for: Buyers stretching a modest income the furthest without giving up a top-10 safety finish. If you’re weighing property types to stretch it further, note that manufactured homes are built to the federal HUD Code and financed under a separate set of lender rules, while modular and prefab houses are built to the same state and local building codes as site-built homes and are generally financed the same way. The distinction changes your loan options, not just your price per square foot.
9. Overland Park, KS
Why it ranks: Overland Park finished 2nd of 182 cities in WalletHub’s 2026 Safest Cities in America index, scoring 70.04 out of 100, the strongest single finish of any city on this page.
Safety metrics: WalletHub’s score blends home and community safety (60 of 100 points) with natural-disaster risk and financial safety (20 points each), so Overland Park’s placement reflects broad, low-volatility performance rather than a single standout crime number.
Housing cost picture: Kansas City metro pricing among the more affordable major-metro suburbs in the country relative to local incomes.
Best for: Midwest buyers and remote workers who want suburban stability at a Midwest price point. Our guide to home types and living covers how suburban housing stock differs from what you’d find closer in.
10. Scottsdale, AZ
Why it ranks: Scottsdale placed 41st of 182 cities in WalletHub’s 2026 index, the strongest Arizona showing among the cities examined here.
Safety metrics: Solid home-and-community safety scoring within WalletHub’s framework. On the road side, Allstate’s 2026 report ranked Scottsdale 13th of 200 cities, at 12.37 years between collisions, good, but outside the top 10 that Fort Collins, Boise, and Cary occupy.
Housing cost picture: The most luxury-weighted market on this list, with a large share of high-end inventory. If you’re shopping at the top of it, our explainer on what actually makes a house a mansion is worth a read before you assume a listing’s label matches its financing category.
Best for: Buyers who want warm-climate, resort-adjacent living and can shop above the local median.
11. Fort Collins, CO
Why it ranks: Fort Collins ranked 2nd of the 200 most populous U.S. cities in Allstate’s 2026 America’s Best Drivers Report, with an average of 14.96 years between collisions, the longest interval of any city on this list.
Safety metrics: This is a driving-risk ranking built from insurance claim frequency, not a crime ranking. Fort Collins did not appear on the published lists of the SmartAsset or WalletHub studies cited here, so pull local crime data before you treat it as a low-crime finding.
Housing cost picture: Northern Colorado pricing sits below Denver and Boulder but has followed the same upward trend as the rest of the Front Range.
Best for: Buyers who commute daily and weight road safety heavily, a metric most “safest cities” lists ignore entirely.
12. Cary, NC
Why it ranks: Cary finished 5th of 200 cities in Allstate’s 2026 driving report, averaging 12.82 years between collisions.
Safety metrics: SmartAsset’s May 2026 midsize study placed Cary 73rd on its published 75-city list, a list drawn from more than 300 midsize cities examined, so a top-75 finish rather than a near-bottom one. Read the denominator before you read the rank.
Housing cost picture: Research Triangle pricing, which has risen sharply with in-migration but remains below comparable Northeast and West Coast suburbs.
Best for: Buyers following jobs into the Raleigh–Durham corridor who want a suburban profile with strong road-safety data.
Safety vs. affordability: where the trade-off actually bites
The expensive-equals-safe assumption is wrong often enough to cost buyers real options. Of the cities with published cost-and-income data, El Paso combined a top-10 safety finish with $1,044 in median monthly housing costs, while San Jose earned the same kind of finish at the top end of the national price range.
| City | Safety rank (source, year) | Relative housing cost | Standout trade-off |
|---|---|---|---|
| San Jose, CA | #1 of 50 (SmartAsset, 2025) | Highest on this list | Best-in-class metrics at the steepest price of entry |
| Plano, TX | #2 of 83 (SmartAsset, 2026) | High for North Texas | Excellent crime data, relatively high disaster risk |
| Overland Park, KS | #2 of 182 (WalletHub, 2026) | Low to moderate | Broadest all-around score, smallest job market of the group |
| Fort Worth, TX | #3 of 50 (SmartAsset, 2025) | $1,489/mo vs. $76,602 income | Strong cost-to-income ratio, high disaster risk |
| Arlington, TX | #7 of 50 (SmartAsset, 2025) | $1,420/mo vs. $73,519 income | Central location, same regional weather exposure |
| El Paso, TX | #8 of 50 (SmartAsset, 2025) | $1,044/mo vs. $58,734 income | Lowest housing cost, lowest median income |
| Boise, ID | #12 of 182 (WalletHub, 2026) | Moderate | Consistent across three studies, fast-rising prices |
Two things follow from that table. First, cost-to-income beats sticker price: El Paso’s housing is the cheapest here, but so is its median income, so the monthly stretch is closer to Fort Worth’s than the raw numbers suggest. Second, “safe” is regional. A North Texas buyer trades weather risk for affordability; a Bay Area buyer trades affordability for almost everything else. Our guide to regional housing market differences walks through how those trades price out market by market.
How to check safety at the street level
City-level rankings screen; neighborhood data decides. Every city on this page contains blocks that look nothing like its citywide average, which is precisely the limitation the FBI flags in its own guidance. Four checks, in order.
- Pull the local police department’s crime map: Most departments publish incident-level data by block and date. That is the closest thing to a ground-truth number, and it is free.
- Visit at three different times: A weekday morning, a weekday evening, and a weekend night. Streets change character on a schedule that no dataset captures.
- Check disaster risk separately from crime: FEMA’s National Risk Index scores communities on 18 natural hazards down to the census-tract level. It is the reason Plano ranks 2nd on one list and 109th on another.
- Compare the housing stock, not just the map: Density, age, and lot size vary enormously between the suburban and in-town options in the same metro, see our comparison of urban vs. suburban housing markets and our overview of home types and living before you narrow the search.
For a national baseline, SafeWise publishes state-by-state crime rate comparisons built from FBI-reported violent and property crime per 1,000 residents. For context on how buyers actually weigh neighborhood factors, the National Association of REALTORS® maintains NAR research on what buyers prioritize in a neighborhood. And if you want to see how settled a market is before you commit, the Census homeownership and vacancy data by metro reports homeownership and vacancy rates for the 75 largest metropolitan statistical areas.
What Michigan buyers should know
You do not have to leave Michigan to shop this way. SafeWise’s 2026 Michigan ranking put six Oakland County communities in the state’s top 10, Oakland Township (2nd), Brandon Township (6th), Lyon Township (7th), Milford (8th), South Lyon (9th), and Berkley (10th), out of 183 Michigan cities that met the reporting threshold.
- The list skews small: Oakland Township posted 0.3 violent crimes and 1.7 property crimes per 1,000 residents. Larger, better-known Oakland County suburbs such as Novi, Troy, and Rochester Hills did not appear in that top 10. A size artifact of the methodology, not evidence they are unsafe. Rank the places you are actually considering against each other, not against a township of a few thousand people.
- Use Michigan’s own data: The Michigan State Police publish the Michigan Incident Crime Reporting (MICR) program’s Crime in Michigan dashboard, with statewide data viewable by city and county and updated on a rolling basis. It is more current than any national ranking, which typically runs one to two years behind.
- Crime shows up in your insurance line, not your rate: Homeowners insurers rate location risk partly on local property crime, theft, and vandalism history, so a low-crime address can reduce that escrow line. The size of the effect varies by carrier and ZIP code, so get a quote on the specific address before you write the offer.2
- West Michigan reads differently: Kent and Ottawa County suburbs around Grand Rapids draw buyers on the same logic, lower density, lower crime, shorter commutes, at prices below the Oakland County corridor. Our look at regional housing market differences covers how the two sides of the state price out.
How Align matches the loan to the property
Lenders do not treat every property the same. Condos, including non-warrantable ones, and homes with two to four units each come with rules that vary from one lender to the next.
Because Align is a broker, Samantha can take your file to the wholesale lender whose guidelines fit the property, instead of forcing it into one bank's box. One application, multiple lenders, and one person on your file from start to finish.
FAQ: Safest cities in the US
Here are answers to common questions about the safest cities in the US.
What makes a city rank as one of the safest in the US?
Most rankings blend several measures rather than one. The common inputs are violent crime rate per 100,000 residents, property crime rate, traffic and vehicular death rates, and public-health indicators such as overdose deaths, with some publishers adding natural-disaster risk or resident survey scores. Because the weighting differs by publisher, the same city can rank very differently across two lists, and because crime data is regional in character, it helps to read a city against its own market rather than the national field. Our guide to regional housing market differences covers that context.
Are the safest cities always the most expensive?
No. Safety and cost track together in coastal metros, but several top-ranked cities break the pattern. Fort Worth, Arlington, and El Paso all placed in the top 10 of SmartAsset’s 2025 study with median monthly housing costs of $1,489, $1,420, and $1,044 respectively, and Boise and Overland Park land high on safety indexes at Mountain West and Midwest pricing. The expensive-equals-safe assumption costs buyers real options, especially in the suburban tier covered in our comparison of urban vs. suburban housing markets.
How can I research the safety of a specific neighborhood?
Start with the local police department’s public crime map, which reports incidents at the block level rather than the citywide average a national ranking uses. Then visit at three different times, a weekday morning, a weekday evening, and a weekend night, and talk to the neighbors directly. City-level rankings are a screening tool; neighborhood-level data is what predicts your experience. Pair that with a look at the local housing stock in our overview of home types and living.
Does buying in a safer city affect my mortgage or insurance?
Not through the city’s crime rate. The CFPB names seven factors that determine your mortgage interest rate, credit scores, home location, home price and loan amount, down payment, loan term, interest rate type, and loan type, and the location factor operates at the state and sometimes county level, not the neighborhood one. Homeowners insurance is a different story: carriers rate location risk partly on local property crime and theft history, so a low-crime area can meaningfully reduce that escrow line. Get an insurance quote before you write the offer, and see our Homeownership guide for how the pieces of a monthly payment fit together.
The bottom line on the safest cities in the US
The safest U.S. cities combine low violent and property crime with safe roads, manageable disaster risk, and stable neighborhoods, and the list changes when the metrics change. San Jose ranked 1st of the 50 largest cities in SmartAsset’s 2025 study; Plano ranked 2nd of 83 in the firm’s July 2026 update; Overland Park ranked 2nd of 182 in WalletHub’s 2026 index. Three defensible answers, three different questions. Affordability is not the tiebreaker people assume it is: Fort Worth, Arlington, and El Paso all landed in a top 10 with monthly housing costs between $1,044 and $1,489. Before you commit, pull block-level crime data, check disaster risk separately, and remember that a low-crime address moves your insurance premium, not your interest rate.
If you’re ready to buy in one of these markets, or anywhere else, talk to Align Lending. We’ll shop your scenario across our lender network and show you the numbers side by side. Call 248-506-5727 or start online today.
Footnotes:
1. Rankings on this page are not interchangeable and are not presented as measurements of absolute risk. Each study uses a different city pool, a different set of metrics, and different weightings, and each draws on crime data that typically lags publication by one to two years. The FBI, whose Uniform Crime Reporting and NIBRS data underlie most of these studies, publishes a standing caution against ranking localities on its statistics, noting that such rankings provide no insight into the variables that shape crime in a given place. Crime totals also depend on which agencies filed complete reports in a given year. Return to text.
2. Homeowners insurance is priced by individual carriers using their own filed rating plans; location-based factors such as property crime history, fire protection class, and weather exposure are among many inputs, and the effect on any individual premium varies by carrier, ZIP code, coverage limits, deductible, and property characteristics. Nothing here is an insurance quote or a prediction of your premium. Align Lending is an independent mortgage broker, does not sell insurance, and does not set loan terms; program terms, eligibility, and pricing are set by the individual wholesale lenders in Align’s network and are subject to change, credit approval, and property eligibility. Nothing here is an offer of credit or a commitment to lend. Return to text.
Sources: San Jose’s first-place finish and its overdose and traffic death rates, the Fort Worth, Arlington, and El Paso rankings, San Francisco’s 37th-place finish and its 63 overdose deaths per 100,000, and all median monthly housing cost and median household income figures, SmartAsset, “America’s Safest Cities – 2025 Study” (FBI 2023 Uniform Crime Reporting data, 2025 County Health Rankings, Census Bureau 2023 five-year American Community Survey). Virginia Beach’s and Plano’s 2026 rankings, Plano’s crime, traffic, and disaster-risk figures, and Irvine’s 12th-place finish, SmartAsset, “America’s Safest Big Cities – 2026 Study,” published July 27, 2026 (FBI 2024 Crime in the United States, CDC, FEMA National Risk Index as of April 2026); that study released only its 10 safest and 10 least safe cities, so no rank is cited here for any city outside those lists. Naperville, Boise, and Cary midsize rankings and Naperville’s crime and traffic rates, SmartAsset, “America’s Safest Midsize Cities – 2026 Study,” May 2026. Overland Park, Boise, Irvine, Scottsdale, San Jose, and Plano index rankings and scores, WalletHub, “Safest Cities in America in 2026,” published October 20, 2025. Fort Collins, Boise, Cary, and Scottsdale driving-safety rankings and years between collisions, Allstate, “America’s Best Drivers Report,” 18th edition, 2026 (property damage claim frequency, January 2023–December 2024, 200 most populous U.S. cities). Irvine’s 18-year violent crime record, City of Irvine news release, October 18, 2023, citing FBI 2022 data. Michigan community rankings and crime rates, SafeWise, “Michigan’s Safest Cities of 2026.” Michigan crime dashboard, Michigan State Police, Michigan Incident Crime Reporting (MICR). Mortgage rate factors, Consumer Financial Protection Bureau, “Seven factors that determine your mortgage interest rate.” Natural-hazard scoring, FEMA National Risk Index. Homeownership and vacancy rates for the 75 largest metropolitan statistical areas, U.S. Census Bureau, Housing Vacancies and Homeownership (CPS/HVS).
This article is for informational purposes only and is not intended to provide legal, financial, tax, or insurance advice. Crime rankings, cost figures, and safety data change as new source data is published, verify current figures before making a relocation or purchase decision, and consult a qualified professional about your situation. Align Lending is an independent Michigan mortgage broker, NMLS #2041154.
Related resources
12-minute read
Condo vs. Co-op: Similarities and Differences Every Urban Buyer Should Know
Compare condo vs. co-op ownership, monthly fees and board approval rules so you can choose the urban home type that fits your budget and lifestyle.
11-minute read
Guide to the Different Types of Houses by Structure and Style
Discover the different types of houses by structure and style, from ranch and colonial to craftsman and Victorian, and find which home type fits your life.
